Two pumps. Not twice the flow.
The second pump changes the pump curve. Your pipe still decides where the plant runs. Move the slider to see the difference, then look inside the valve that can leave a spare moving nothing.
Your simulator. Plain English.
Reflux Student works with your own Aspen Plus V14 on Windows. Open a case, change the inputs and run it from a prompt. Three free runs to start, using your own Aspen licence.
Use another simulator? Join the trial waitlist
Tell us what you use. Your signup helps decide what we support next.
You're on the list.
We'll email you when the build that speaks your software is ready.
Same pumps. A different gain.
Identical pumps in parallel add their flows at the same head. At a given total flow, each pump carries half. The new operating point is where that combined curve meets the unchanged system curve.
Illustrative fixed-speed model: H₁ = 60 − 0.004Q²; H₂ = 60 − 0.004(Q/2)²; Hsys = 10 + KQ², with Q in m³/h and head in metres. The slider changes K. The +39% and +75% presets reproduce the quoted gains with illustrative curves; they are not reconstructed vendor data.
As friction grows, the second pump buys less flow. The gain approaches 100% only in the ideal zero-resistance limit of this model. Actual selection also needs the vendor curve, allowable operating range, NPSH and motor checks.
Spinning does not mean delivering.
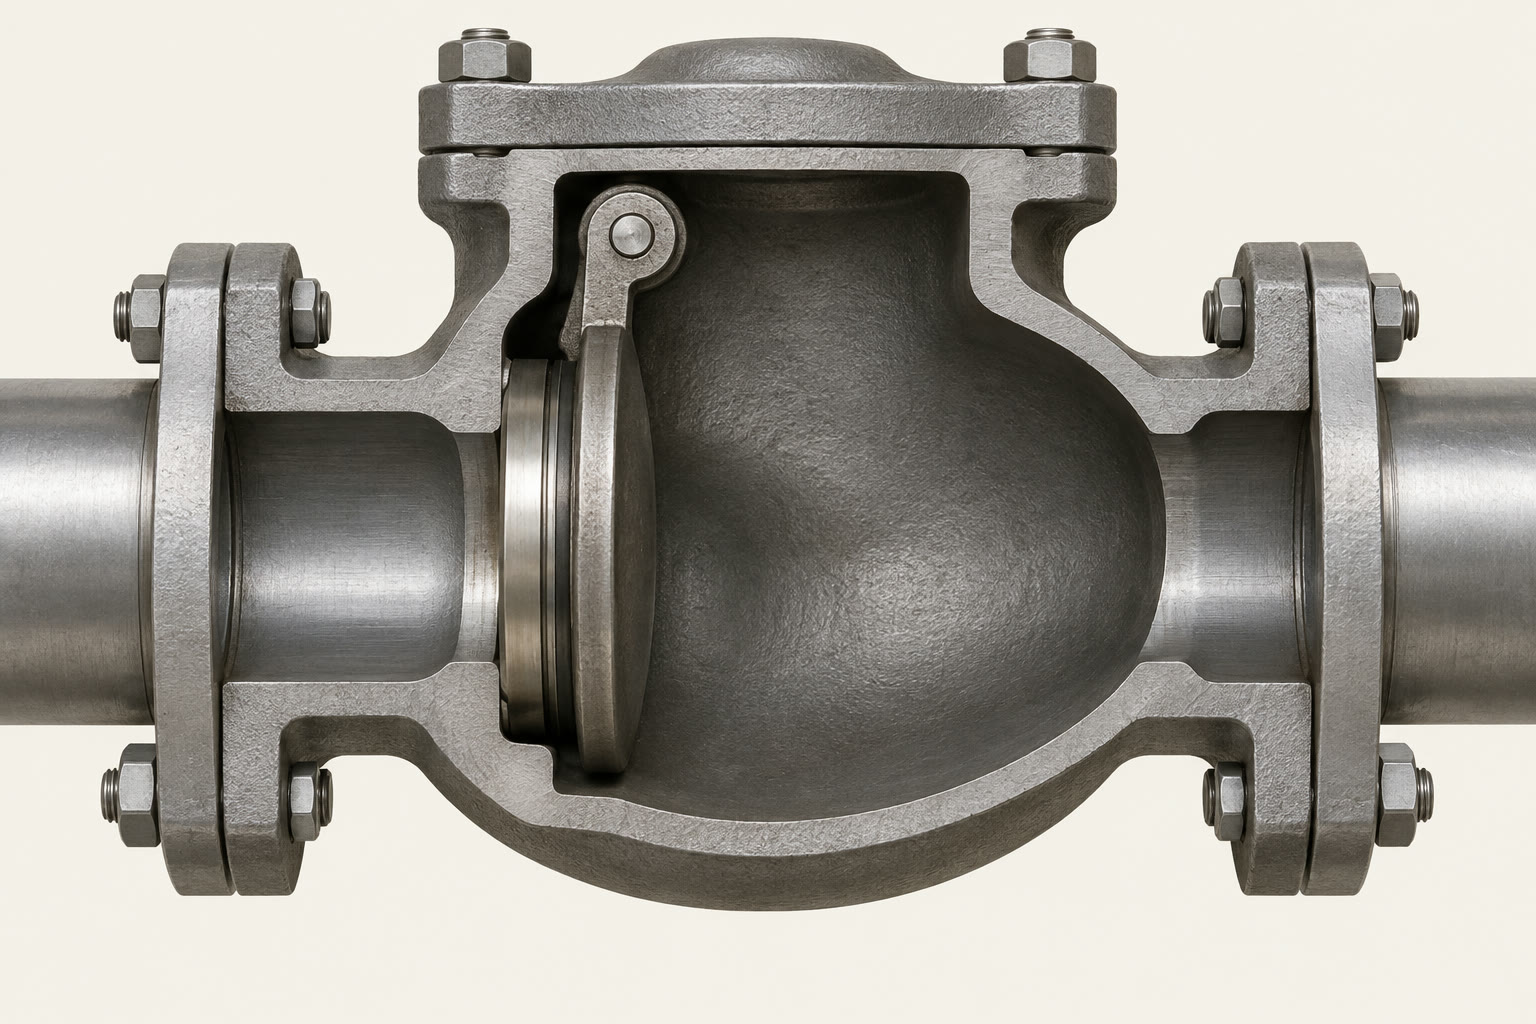 CLOSED
A check valve on each branch prevents reverse flow. A starting pump cannot open its valve if the downstream header pressure exceeds the pressure it can develop at zero flow, allowing for suction pressure and the valve's opening requirement.
This is a lower-shutoff-head or reduced-speed pump example. Two identical healthy pumps at the same speed and suction conditions are a different case. The cutaway above shows the closed state; the pressure control reports whether opening is possible, not a prediction of full operating flow.
40 bar was the requirement.
These are the reported CHE480 Tutorial 3 results for 25 wt% aqueous DEA entering at 20 bar and 40°C. Different pump selections were tested in the three arrangements, so this table does not mean that series pumps inherently make less head.
| Tested arrangement | Discharge | Total brake power | 40 bar duty |
|---|---|---|---|
| One pump | 43.7 bar | 34.7 kW | Meets |
| Three in parallel | 46.4 bar | 51.8 kW | Meets |
| Three in series | 39.3 bar | 28.2 kW | Below spec |
The notes identify the single pump as the best tested balance of simplicity, capital and power. They separately propose two duty stages in series with a spare parallel to the second stage. That proposal was not simulated. The reel's “two at 50% plus a spare” is a shorthand, not another measured row in this table.
A general two-duty-plus-standby parallel design is useful when each duty unit supplies half the required flow at the full required head. It still needs to be checked against the actual system and valve conditions.
The plant lives at the intersection.
Equipment curves are constraints. The connected system chooses the operating point. Reflux helps you work through the model in your simulator, with assumptions and results you can inspect.
Sources and assumptions
- Hydraulic Institute: combined pump and system curves.
- KSB: parallel operation and unequal shutoff heads.
- Pumps & Systems: the worked +39% and +75% comparison cited in the reel.
- CHE480 Tutorial 3, Pumps Summary, supplied course notes. Results and proposed arrangement are distinguished above.
The equipment images are generated educational cutaways. Curves are illustrative calculations, not an equipment selection or an Aspen simulation.