
Engineering explained / SALT
The sea is full of water.
The salt pushes back.
Reverse osmosis is a pressure contest. Follow the water through a membrane, turn up the recovery, and watch the far end become the hard part.
The agent layer behind the engineering
Try Reflux on your own Aspen Plus.
Describe the work in plain English. Reflux makes changes in Aspen, runs the case, and reads back the result. Windows, your own Aspen Plus V14 licence, three free runs to start.
Use another simulator? Join the trial waitlist.
Tell us what you use. We’ll email you when a suitable build is ready.
You’re on the list. We’ll email you when a build for your software is ready.
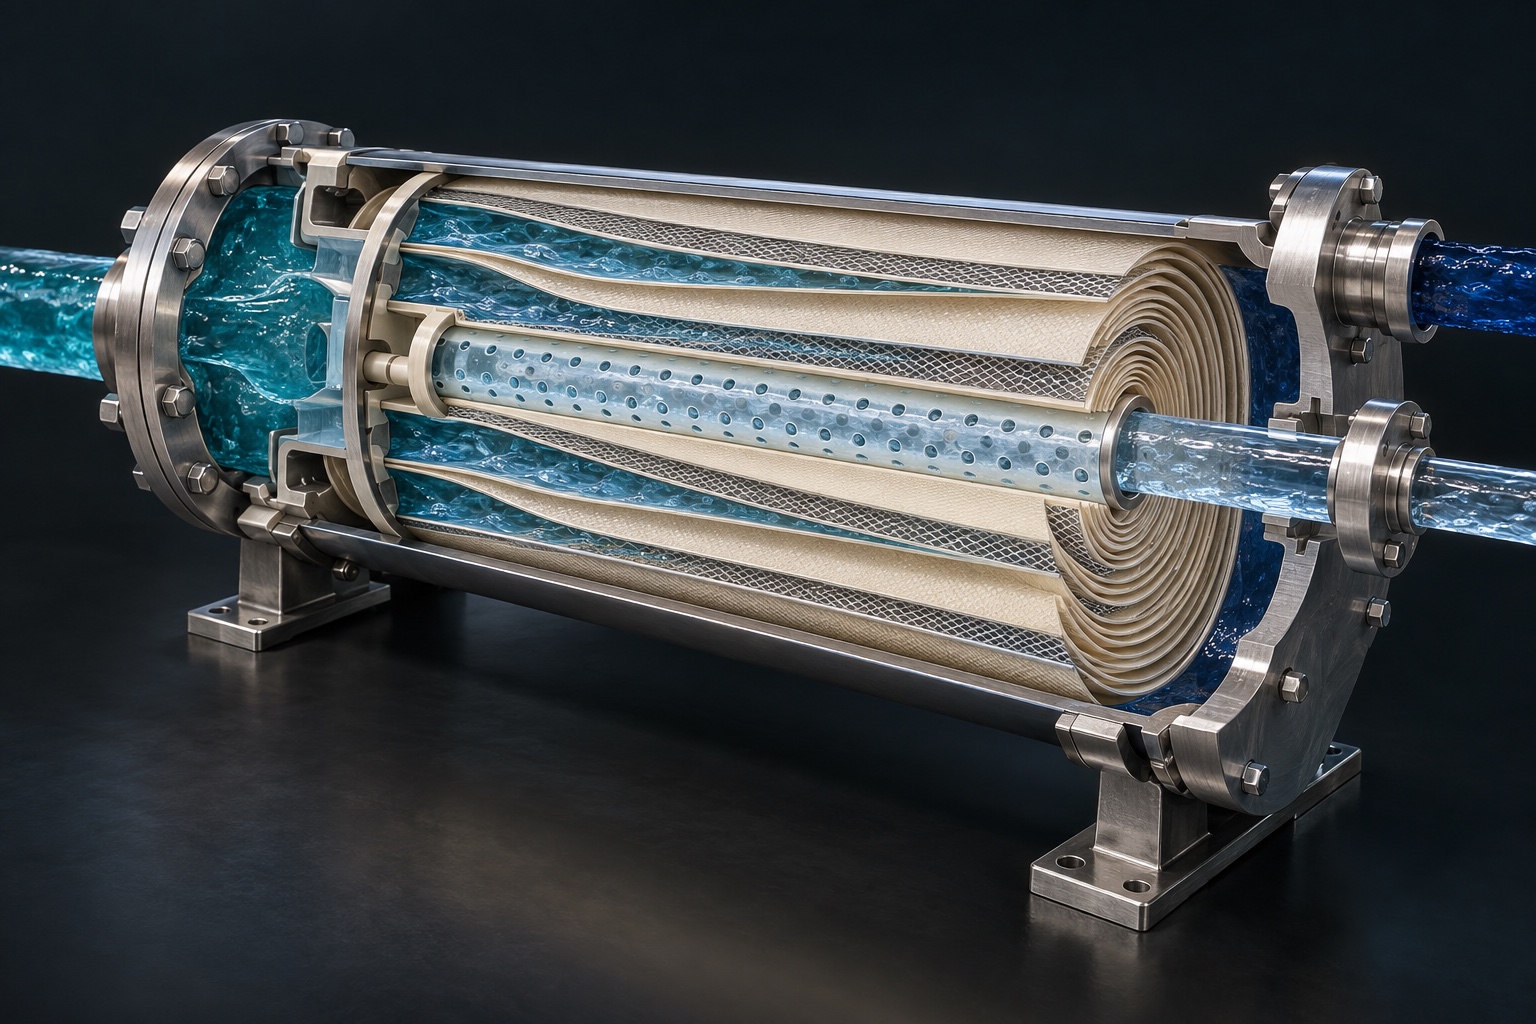
01 / The far end
More fresh water. Less pressure margin.
Ordinary osmosis moves water toward the salty side. Reverse osmosis applies pressure to that side to reverse the net flow. As fresh water leaves, the remaining brine gets saltier. Its osmotic pressure rises while friction eats a little of the feed pressure.
Pressure still exceeds the salt’s pull at the outlet.
A negative gap is a warning about your selected conditions. This simple model does not solve for a physically achievable recovery or predict a negative production rate.
Equations and assumptions
πᵦ ≈ π𝒇 / (1 − R)
Vᵦ / Vₚ = (1 − R) / R
Driving pressure ≈ P𝒇 − ΔP − πᵦ
R is recovery. This illustrative model assumes complete salt rejection, negligible permeate salinity and pressure, π𝒇 = 27 bar at 35 g/L, proportionality between concentration and osmotic pressure, and 2 bar of feed-channel pressure loss. Cumulative recovery is distributed uniformly along the plotted tube. Real designs require membrane transport, concentration polarization, temperature, scaling and fouling limits, and actual hydraulics.
At 50% recovery, the brine-to-fresh-water ratio is 1:1. The reel’s 1.5:1 number is a different measure: a global average across desalination technologies in a 2019 study. It is not the mass balance for a 50%-recovery RO plant. That distinction is why the slider shows one litre of brine at its starting point.
02 / The energy ladder
There is a floor. It is not the whole bill.
Salt and water can only be separated by doing work. For seawater near 35 g/L at 50% recovery, a commonly cited reversible minimum is about 1.06 kWh per cubic metre of product water. Actual electricity use depends on the plant and on what its meter includes.
- 1.06Physics floor
- ~2.3Efficient plants
- 2.9–5.5Reported plant range
- >6Early SWRO / historical
All rungs: kWh/m³ of fresh water. These are reference benchmarks, not four directly comparable contemporary designs. Intake, pretreatment, pumping, membrane separation and post-treatment boundaries differ. The historical reduction reflects better membranes, pumps, plant design and energy recovery together.
What the simple model predicts
The ideal proportional-pressure model gives 1.04 kWh/m³ for the selected salinity and recovery. The 1.06 reference uses seawater thermodynamics; the small difference is expected.
1 bar·m³ = 1/36 kWh. This is reversible separation work; it excludes real process losses and auxiliary loads.
03 / The pressure comes back
The brine leaves with energy still in it.
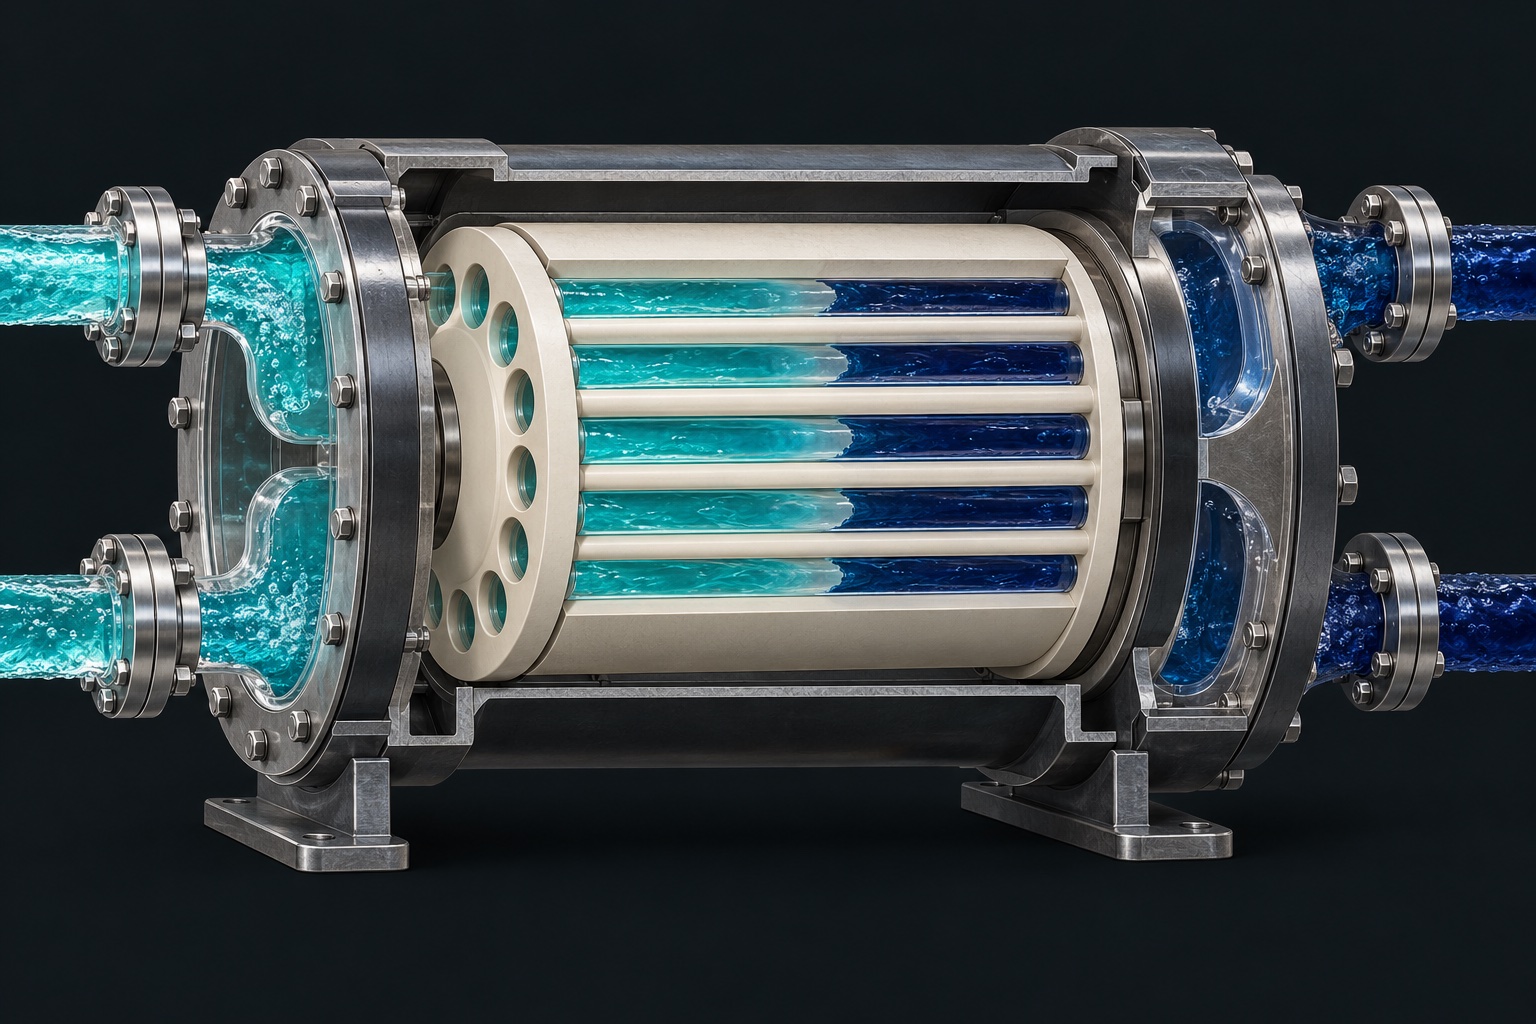
A rotary isobaric pressure exchanger uses the pressurized reject stream to pressurize incoming seawater. Its quoted efficiency can be around 98% for hydraulic energy transfer. That number belongs to the device, not to the entire desalination plant.
For the selected conditions above, recovering brine pressure reduces this model’s hydraulic duty by 47%. The pump still supplies net work.
What is included in this comparison
Wᵣ = ηₑ (P𝒇 − ΔP) (1 − R) / (36 R)
Wₙₑₜ = W₀ − Wᵣ
ηₑ = 0.98 and ΔP = 2 bar. This is an idealized hydraulic energy balance per cubic metre of permeate. It is not metered plant electricity; motor and pump losses, booster configuration, mixing and auxiliary loads are excluded. If the selected recovery has no outlet pressure margin, the energy numbers describe that hypothetical balance, not a feasible operating point.
Read the underlying work
Sources and model boundaries
- Elimelech & Phillip, Science (2011): thermodynamic limits and the energy, technology and environmental context for seawater desalination.
- Water (2016), Predicting the Specific Energy Consumption of Reverse Osmosis Desalination: energy accounting, reference ranges and model dependence.
- Energy Recovery, PX Q400 white paper (2025): direct pressure exchange, 40–50% typical recovery, and device efficiency measurements.
- Jones et al., The state of desalination and brine production (2019): approximately 142 million m³/day brine and 95 million m³/day product in the historical global dataset.
The interactives are educational balances. They do not size membranes or predict potable-water quality, safe brine discharge, or a plant’s operating cost. Salt rejection, remineralization and outfall design are separate engineering problems.
Build the model. Keep the judgment.
Try Reflux on Aspen Plus, or tell us which simulator should come next.
Nathan Ruberto · Reflux
Explore the engineering library →