
Three drawings.
One plant.
A plant is three drawings before it is anything. Each one answers a different question, and only the last one an operator can push a button on. Here is the same pump drawn all three ways, the tag rule that lets you read any sheet, and the two numbers that size every pipe.
Reflux Student builds the middle one in Aspen Plus from a sentence. Try it free on Aspen Plus →, or jump straight to the drawings.
Out now
Try Reflux Student free on Aspen Plus
Reflux Student drives your own Aspen Plus V14 from plain English. You type what you want, it opens the case, makes the change in Aspen, runs it, reads the result back and tells you what it verified. Aspen does the math. You keep the judgment. Windows, your own licence, and free to start is a trial with a limit on it, not a free product.
Enter your email on the next page and the download link lands in your inbox, so you can open it on the Windows machine Aspen lives on. Windows will say it does not recognise the app the first time: click More info, then Run anyway. The certificate is new and Windows trusts it by reputation, which takes downloads to build. Nothing is wrong with the file.
Not on Aspen Plus? Tell me which simulator you use → and you hear the day your build exists.
The same pump, three ways.
One piece of equipment. Three drawings, each carrying exactly the detail its question needs. Read it top to bottom and you are watching a plant get specific.
The block flow diagram is a box and two arrows. It says what happens and what crosses the boundary, and it closes one mass balance. It fits on a napkin, and its job is to decide whether the plant is worth drawing in more detail.
The process flow diagram gives the unit a code and every stream a number, and puts a table underneath with the flow, composition, temperature and pressure of each one. This is the drawing a simulator makes. It is the one most people mean by the process.
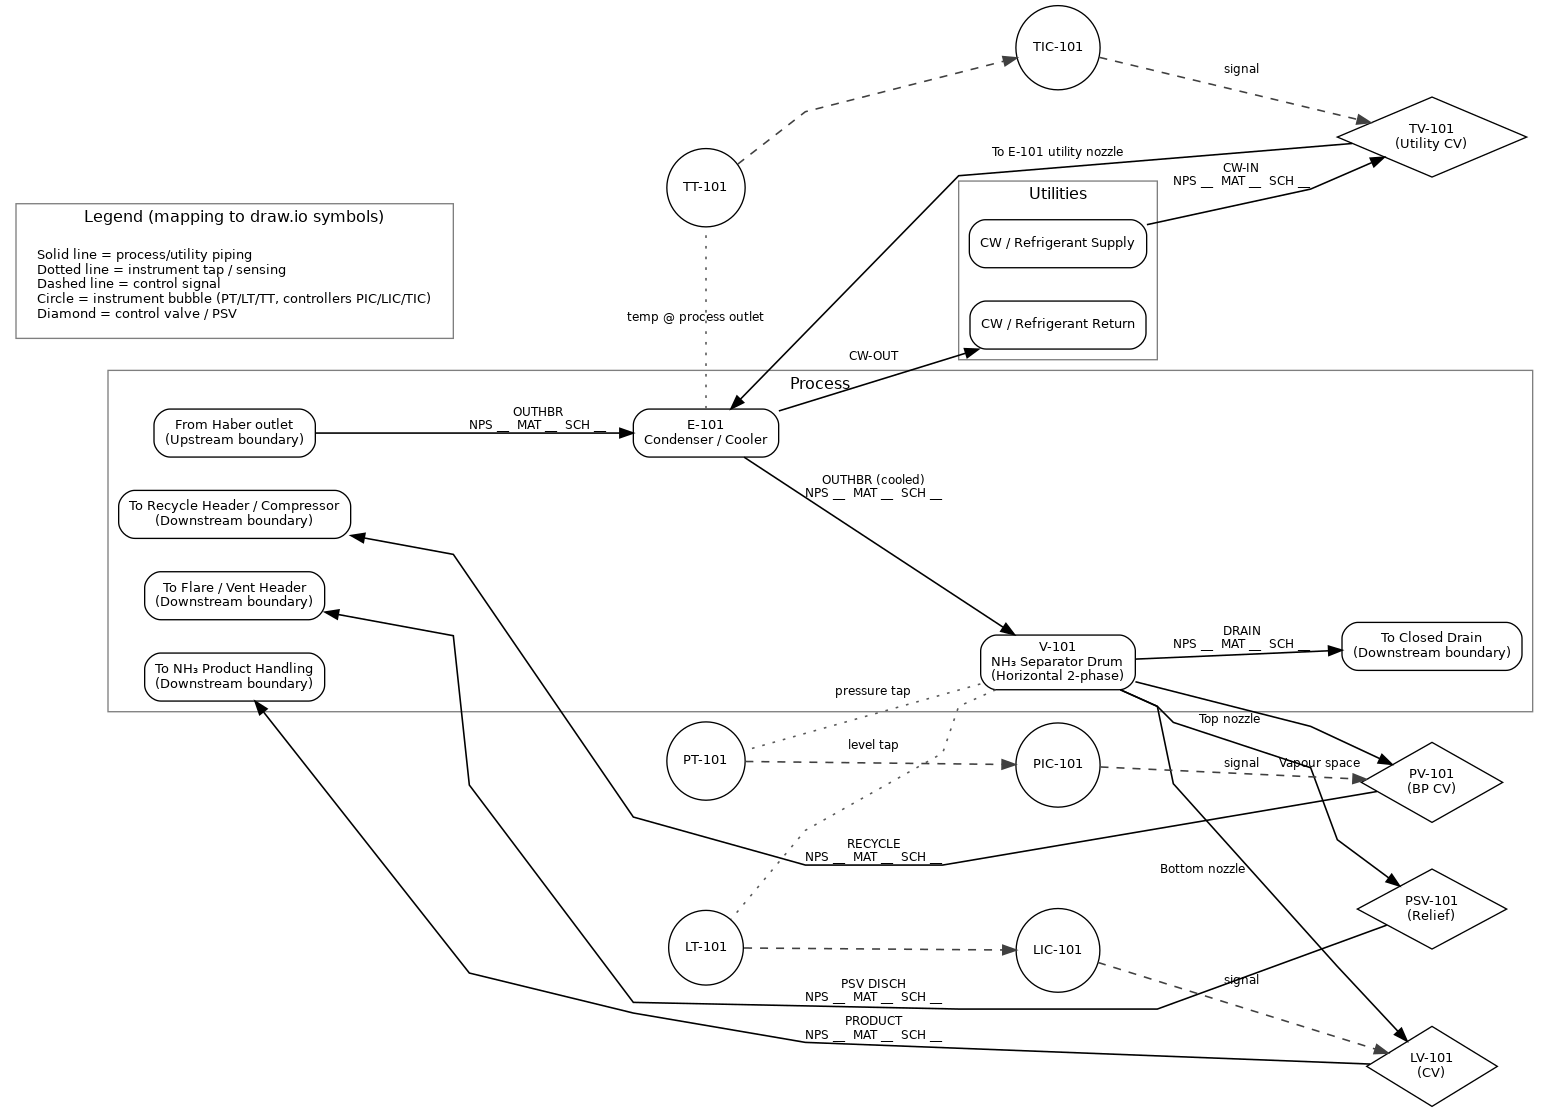
The P&ID adds the things that get bought, welded and commissioned: the spare pump, the line number, the piping class change, the valve, and the control loop that decides where that valve sits. It is the sheet the safety review runs on.
The one tag rule.
Two conventions. Between them you can read a sheet from a plant you have never seen.
Equipment gets a letter for the type, then the area, then the unit, then a suffix if there is more than one machine doing the same job.
Instruments get a first letter for what is measured and following letters for what the device does. That is ISA-5.1, and it is the part worth memorising.
F TFlow Transmitter. First letter is the
measured variable: F flow, T temperature, L level, P pressure, A analysis.F I CFlow Indicating
Controller. Letters after the first are the function: T transmitter,
I indicator, C controller, V valve, A alarm.F VFlow Valve. The element that moves.The number is the trick. FT-101, FIC-101 and FV-101 share
loop 101, and that shared number is what says they are one control loop: the
transmitter measures, the controller decides, the valve moves. A bubble with a solid line
through it is panel mounted, so the control room sees it. A plain bubble is out in the field.
Line numbers work the same way. 3"-CS-1004-P is a three inch line, carbon steel,
line 1004, process service. That string is what makes a pipe orderable.
Sources: Turton et al. on equipment tags and ISA-5.1 for the instrument letters.
The two numbers that size every pipe.
Every line on a P&ID has a size, and the size comes from two checks. Velocity picks the diameter. Pressure drop confirms it. When they disagree, pressure drop wins and the line goes up a size.
Size the pump discharge line
Liquid ammonia off the separator pump. Illustrative incompressible model: Swamee and Jain friction factor, commercial carbon steel at 0.045 mm roughness, Schedule 40 bore, no fittings.
| Check | Value | Usual band |
|---|
Rounding up to a bore you can actually buy always lands the pressure drop on the low side of the band, because drop falls steeply with diameter. That is the expected direction. A real line also carries fittings, control valve drop, static head, and the pump curve it has to sit on.
This is the short version, aimed at getting a size onto a P&ID. The long version is on the line sizing page →: where the one psi per hundred feet rule comes from, why the velocity floor matters as much as the ceiling, and the erosional constant nobody can derive.
Which drawing, and when.
| Drawing | Answers | Carries |
|---|---|---|
| Block flow | Is this worth doing at all? | Blocks, arrows, one mass balance |
| Process flow | What is the process, in numbers? | Equipment codes, numbered streams, a conditions table |
| P&ID | What gets built, and how is it controlled? | Every pipe sized, every valve, every instrument and loop, tagged |
The order matters because the cost of a change climbs with it. Moving a box on a block flow diagram is a minute. Moving a unit on a P&ID moves line numbers, instrument loops, the stress work and the procurement package behind them.
The P&ID is also the document the hazard study runs on. A HAZOP is conventionally held when the P&IDs are near issue, because the study needs the valves, the trips and the relief paths to be on the sheet to have something to argue with. More on where each drawing sits in a project.
A note on the name: P&ID has more than one accepted expansion. Piping and instrumentation diagram is the common one, and it is the one used here.
The sheet from the video.
This is the ammonia separator P&ID behind me in the reel: one separator drum, one condenser, four control loops, one term of fourth year. Design Report 2, CHE 480.
Reflux Student draws the middle one.
Describe the process in a sentence and Reflux Student builds it in your own Aspen Plus, runs it, and reads the result back to you. It drew the five stage compressor train in Tuesday's video. You keep the judgment.
Sent because you commented PID. If something here is wrong, reply and tell me. I would rather fix it.
← reflux.sh