
Engineering explained / BREW
The beer makes heat.
The jacket makes the recipe.
Inside the tank, yeast are making alcohol, carbon dioxide and heat. Grow the tank and the cooling surface struggles to keep up. Move the size slider and see why.
The agent layer behind the engineering
Try Reflux on your own Aspen Plus.
Describe the work in plain English. Reflux makes changes in Aspen, runs the case, and reads back the result. Windows, your own Aspen Plus V14 licence, three free runs to start.
Use another simulator? Join the trial waitlist.
Tell us what you use. We’ll email you when a suitable build is ready.
You’re on the list. We’ll email you when a build for your software is ready.
01 / The scale-up trap
100× the beer.
Only 21.5× the wall.
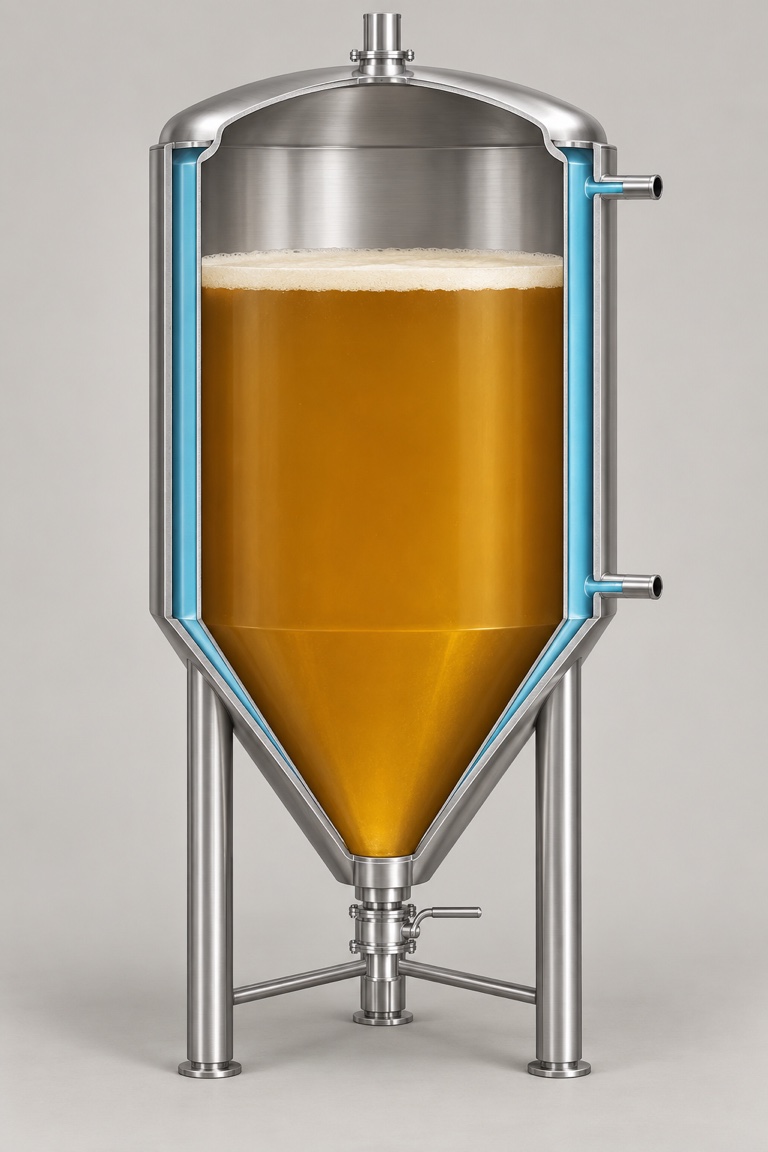
A larger tank has more cooling area, but less area for each litre of beer. This comparison keeps the shape and jacket coverage the same.
10 to 1,000 hectolitres. 1 hL = 100 litres.
An illustrative multiplier on U × jacket coverage × temperature difference.
 10 hL1,000 hL
Conceptual generated cutaway. Glycol stays in the outer jacket, separate from the beer. Relative linear size is accurate; equipment details are illustrative.
V ∝ L³ A ∝ L² A/V ∝ V−1/3
At 1,000 hL, each litre has 4.64× less cooling wall than at 10 hL.
02 / The energy balance
Heat in. Heat out.
The difference stays in the beer.
The jacket carries fermentation heat into a circulating glycol loop. The chiller rejects that heat to the surroundings. Around −3 °C can be a glycol supply temperature; it is not the beer temperature and the circulating mixture remains liquid.
Illustrative peak day, using the sliders above
The jacket cannot remove the peak fermentation heat at the target temperature.
Show the model assumptions
The reference 10 hL tank generates 1 kW at peak and removes 1 kW at the target temperature. This is a chosen example, not a recommended design duty. Heat generation scales with volume; cooling at setpoint scales with area and the selected improvement. Density = 1 kg/L, cp = 4 kJ/(kg·K), ambient heat ignored. The displayed temperature trend is the instantaneous derivative at setpoint, not a predicted final temperature. As beer warms, the temperature difference and cooling change. The time curve illustrates a peak, not measured yeast kinetics. Real sizing also includes batch schedules, crash cooling, heat leaks, jacket coverage, flow and equipment performance.
Why “about ten degrees” is an estimate
With 8 kg of fermented sugar per hL, a heat release of 500 kJ/kg and 100 kg of liquid with cp ≈ 4 kJ/(kg·K), no cooling gives ΔT ≈ 10 °C. Choosing 400–600 kJ/kg as a sensitivity range changes that to 8–12 °C. These are illustrative assumptions, not a universal fermentation rise.
ΔTadiabatic = (8 kg × 500 kJ/kg) / (100 kg × 4 kJ/(kg·K)) = 10 K
03 / Temperature is part of the recipe
A few degrees can change the flavour.
Yeast choice and temperature both matter. The BJCP guide gives typical ale and lager temperature bands, with exceptions by strain.
The guide reports that a fourfold increase in ester production can occur between 16 and 20 °C. This example is not a universal law, and changing temperature alone does not turn ale yeast into lager yeast.
04 / The other product
The gas adds up.
Using about 4 kg of CO₂ generated per hL, the selected tank produces:
That is total batch production, not the gas flow rate at every moment. Alcohol strength and attenuation change the actual amount.
CO₂ is colourless and can accumulate in poorly ventilated low spaces. Gas monitoring and properly designed venting matter. This calculator is not a ventilation design tool.
Recovered fermentation CO₂ can be cleaned, compressed and reused. Atlas Copco gives an example of 3 kg used per hectolitre, not per tank; that plant-use figure is not a target dissolved carbonation concentration.
Sources & scope
Follow the numbers.
- BJCP: Yeast and Fermentation. Typical temperature ranges and the possible fourfold ester example.
- G&D Chillers: brewery glycol sizing. Supply temperatures, peak loads and simultaneous cooling duties.
- Atlas Copco: brewery CO₂ recovery. Approximate gas generation and brewery demand per hectolitre.
- Brewers Association: venting and management of CO₂. Exposure depends on the actual brewery and needs measurement.
- Standard thermodynamic quantities. Glucose → 2 ethanol + 2 CO₂ gives about −69 kJ/mol using the stated standard formation values, roughly 380 kJ/kg glucose. Actual fermentation heat and extract composition vary. The 500 kJ/kg used above is an illustrative input.
- Scale ratios follow directly from geometric similarity. 1002/3 = 21.54; 1001/3 = 4.64. The interactive energy model is a teaching example, not equipment selection or a fermentation kinetics model.
Build the model. Keep the judgment.
Reflux helps you work in the simulator you already use.