
Hydrodynamics
Where does the material actually go? Measure mixing, residence-time distribution, gas dispersion and solids suspension at relevant conditions.
ENGINEERING EXPLAINED / PILOT
Your reaction works. Now find out whether your plant will.
Explore the scale-up lab ↓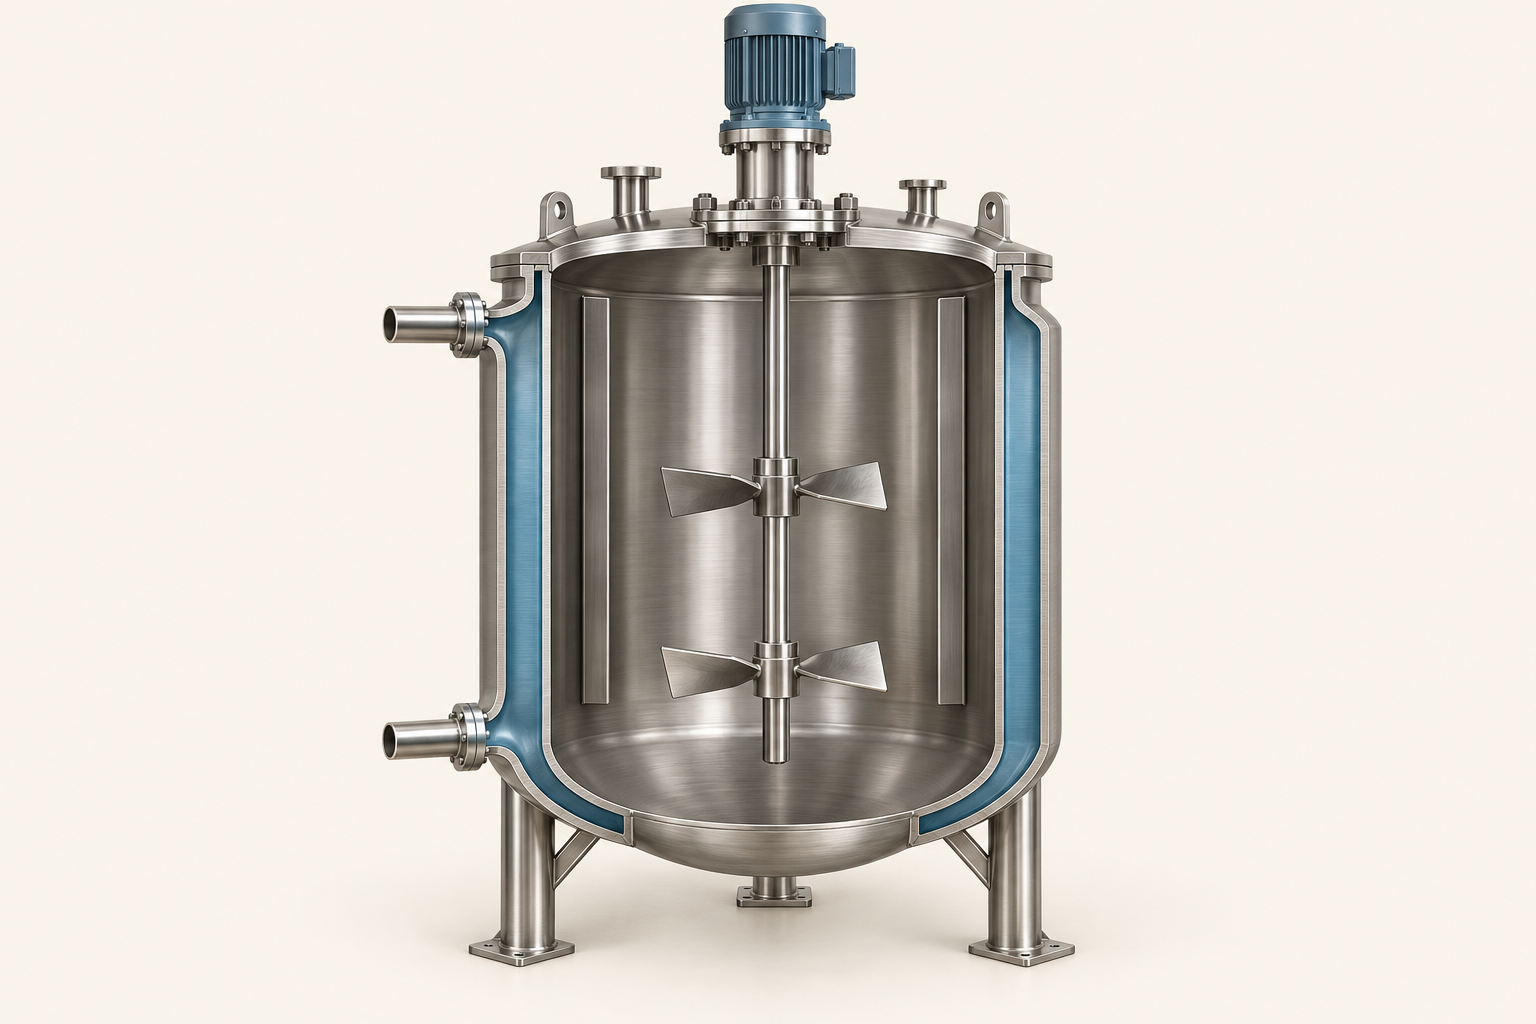
REFLUX FOR YOUR WORK
Join the Reflux trial waitlist. Tell us which simulator you use, and we’ll email you about availability.
Aspen Plus on Windows? Try Reflux Student →The guide below is free. No signup needed.
01 / GEOMETRY CHANGES THE RULES
Move the volume slider. The cooling surface grows, but the liquid inventory grows faster. The three vessels below are an illustrative geometrically similar family; real flasks and production tanks have different shapes.
Logarithmic scale · 10 to 1,000 litres
Each litre has about 46% as much jacket area as before.
Heat generated at a fixed rate per litre scales with volume. Heat removal also depends on U and the temperature difference: Q = UAΔT.
Working liquid is a cylinder with liquid height equal to diameter. V = πD³/4; the side jacket area is πD², so A/V = 4/D. Dished ends, coils, headspace and partial jacket coverage are excluded. The artwork is illustrative and its dimensions are not used in the calculation. The relative scaling applies to geometrically similar equipment. Real heat removal also depends on the heat-transfer coefficient, temperature driving force, fouling, viscosity and coolant flow.
02 / THE LIQUID DOES NOT READ YOUR FLOWSHEET
Watch a tracer spread from the agitator. Choose what stays constant as the vessel grows. The blend-time estimate changes with the scale-up rule.
Animation slowed for visibility. A teaching correlation, not a mixing design.
Assume geometrically similar, baffled, fully turbulent vessels with the same liquid and impeller family, constant power number, and Ntmix approximately constant. Since P/V ∝ N³D², constant P/V gives N ∝ D⁻²ᐟ³ and tmix ∝ V²ᐟ⁹. Constant tip speed gives tmix ∝ V¹ᐟ³. Constant N gives constant dimensionless mixing time under these assumptions, but P/V then rises as V²ᐟ³.
These rules cannot all stay constant at once. Viscous flow, gas dispersion, solids suspension and scale-dependent circulation require different correlations and experimental validation. See Handbook of Industrial Mixing (Wiley) for the underlying mixing framework.
03 / A HISTORICAL WARNING
The 1981 RAND study examined 44 innovative process plants. More than half missed their production goals during months 7–12 after start-up.
This is a historical sample, not a current industry-wide failure probability. The study investigated new technology and solids handling as contributors to performance shortfalls.
Read the original RAND report ↗ · OSTI abstract ↗>½below production goals
months 7–12 after start-up
44 icons = sample size. No exact failed-plant count is implied.
04 / WHAT THE PILOT IS FOR
Where does the material actually go? Measure mixing, residence-time distribution, gas dispersion and solids suspension at relevant conditions.
What changes after hours or weeks? Watch wall deposits, heat-transfer loss, plugging and cleaning requirements.
What survives the service? Check corrosion, erosion, seals and compatibility with the real process mixture.
What happens during a disturbance? Test sensor response, actuator limits, control strategy and start-up or shutdown behaviour.
A pilot can still investigate chemistry. Its distinctive value is testing the coupled process and equipment under representative conditions.
05 / THE MODEL-TO-PLANT GAP
A basic steady-state flowsheet balances streams at an operating point. That alone does not establish jacket performance, mixing, deposition or control response. Equipment models can include geometry, heat-transfer area and solids; dynamic models can resolve time. Specify and validate the physics your scale-up needs.
Fluidised-bed scale-up is a good example: Cocco and Chew explain that development can take more than ten years. That is a possible development timescale, not a minimum for every project. AIChE, 2024 ↗